
Accredited by NAAC with "A" Grade
Accredited by NAAC with "A" Grade
|
Year |
No. of students appeared for exam |
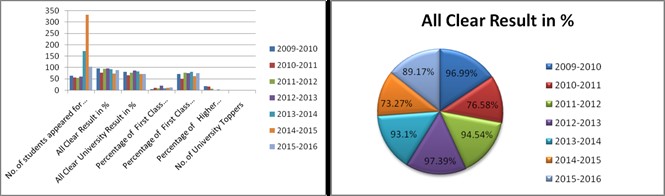
All Clear Result in % |
All Clear University Result in % |
Percentage of First Class with distinction Students |
Percentage of First Class Students |
Percentage of Higher Second Class |
No. of University Toppers |
|
2009-2010 |
65 |
96.99 |
81.83 |
6.15 |
72.38 |
18.46 |
0 |
|
2010-2011 |
56 |
76.58 |
65.23 |
10.71 |
49.8 |
16.07 |
1 |
|
2011-2012 |
55 |
94.54 |
78.15 |
9.09 |
78.18 |
7.27 |
0 |
|
2012-2013 |
60 |
97.39 |
87.36 |
20.04 |
75.47 |
1.88 |
2 |
|
2013-2014 |
174 |
93.1 |
83.58 |
8.62 |
81.61 |
2.87 |
0 |
|
2014-2015 |
333 |
73.27 |
71.25 |
9.61 |
62.76 |
0.9 |
0 |
|
2015-2016 |
104 |
89.17 |
71.25 |
12.22 |
75.65 |
1.3 |
0 |
| Year | No. of students appeared for exam | All Clear Result in % | All Clear University Result in % | Percentage of First Class with distinction Students | Percentage of First Class Students | Percentage of Higher Second Class | No. of University Toppers |
| 2009-2010 | 65 | 96.99 | 81.83 | 6.15 | 72.38 | 18.46 | 0 |
| 2010-2011 | 56 | 76.58 | 65.23 | 10.71 | 49.8 | 16.07 | 1 |
| 2011-2012 | 55 | 94.54 | 78.15 | 9.09 | 78.18 | 7.27 | 0 |
| 2012-2013 | 60 | 97.39 | 87.36 | 20.04 | 75.47 | 1.88 | 2 |
| 2013-2014 | 174 | 93.1 | 83.58 | 8.62 | 81.61 | 2.87 | 0 |
| 2014-2015 | 333 | 73.27 | 71.25 | 9.61 | 62.76 | 0.9 | 0 |
| 2015-2016 | 104 | 89.17 | 71.25 | 12.22 | 75.65 | 1.3 | 0 |
![]()
![]()
![]()
![]()
![]()